Technical Manual of the Ceylan-Traces Layer

| Organisation: | Copyright (C) 2010-2025 Olivier Boudeville |
|---|---|
| Contact: | about (dash) traces (at) esperide (dot) com |
| Creation date: | Sunday, August 15, 2010 |
| Lastly updated: | Sunday, September 14, 2025 |
| Version: | 1.0.26 |
| Status: | Stable |
| Dedication: | Users and maintainers of the Traces layer. |
| Abstract: | The role of the Traces layer (part of the Ceylan project) is to provide Erlang applications with advanced trace services, so that the user can efficiently log, browse and search through detailed runtime messages that may be emitted concurrently (i.e. in a parallel, distributed way) by all kinds of processes. We present here a short overview of these services, to introduce them to newcomers. The next level of information is either to browse the Traces API documentation or simply to read the corresponding source files, which are intensely commented and generally straightforward. |
The latest version of this documentation is to be found at the official Traces website (http://traces.esperide.org).
This Traces documentation is also available in the PDF format (see Ceylan-Traces-Layer-technical-manual-english.pdf), and mirrored here.
Overview
This layer is in charge of providing Erlang programs with the means of emitting, collecting, storing and browsing applicative traces (i.e. logs - not related in any way to Erlang tracing).
This means that both user-originating traces (that your code emits thanks the Traces API) and standard Erlang logs are routed and centralised in a single view whose purpose is to help monitoring your application(s) as a whole.
For that, various types of components have been designed and implemented, such as a trace aggregator, emitter, listener, supervisor, bridge, etc.
They collectively constitute the Traces layer, whose only prerequisites (besides Erlang itself, of course) are the WOOPER layer (for object-oriented primitives) and the Myriad layer (for many lower-level services; itself a prerequisite of WOOPER).
Traces can be readily built and run on most Unices (including of course GNU/Linux) and on Windows. The project repository is located here.
The main purpose of this Traces layer is thus to provide adequate traces (i.e. advanced logs) for distributed systems (a rather critical feature in order to debug in these difficult contexts), and to ease their study and browsing. A few backends are available for that, from the direct reading of basic (text) trace files to considerably more user-friendly solutions, such as the generation of PDF reports or the use of our more advanced trace format, which can be read notably by commercial tools such as LogMX [1].
| [1] | The Ceylan-Traces layer defined a trace format of its own, supported by our Java-based parser for LogMX. For what it is worth, LogMX is the only non-free, commercial tool on which we rely, as we find it quite convenient. Devising an interface to any other log browsing tool of interest is certainly a rather reasonable option. Pull requests welcome! |
Finally, an effort has been made to lessen the runtime impact of this service when it is enabled, and to pretty remove it as a whole (hence with no runtime overhead) when disabled (through flexible build options).
Trace Severities
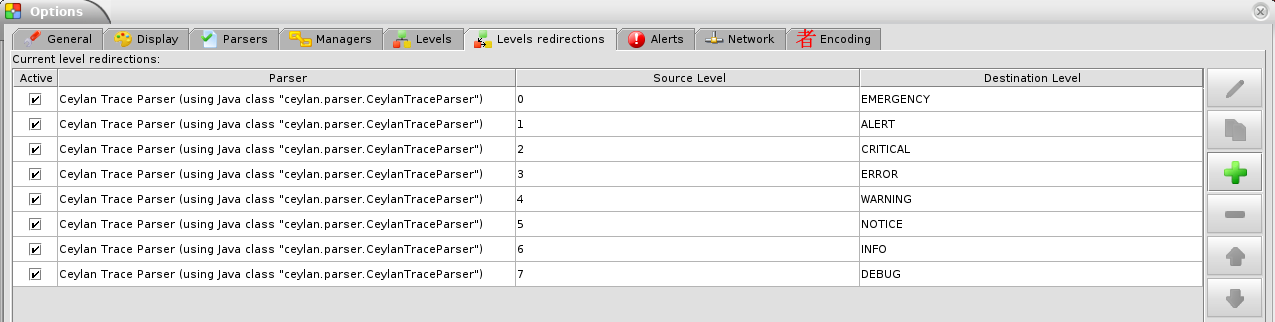
Traces now relies on the same conventions as the ones of the newer standard logging facility in Erlang/OTP, logger, which itself obeys the Syslog protocol, as defined in RFC 5424.
There are eight built-in levels for trace channels, of increasing severity:
| Trace Severity | Mapped Priority |
|---|---|
| debug | 7 |
| info | 6 |
| notice | 5 |
| warning | 4 |
| error | 3 |
| critical | 2 |
| alert | 1 |
| emergency | 0 |
Starting from notice [2] onward (thus included), these severities are considered as significant enough to never be disabled (thus their messages will be created and sent to the trace aggregator in all cases).
| [2] | A good practice is to only send few notice messages (a fixed/bounded number of them). For example, one of such messages may be sent once a singleton instance is fully constructed (avoiding one notice message per call of a given request, or one per instance - should there may be many of them). |
Moreover the severities that are "error-like" (starting from warning onward) will be sent synchronously to the trace aggregator, and echoed on the console as well, to ensure none is lost. Doing so is certainly a bit more resource-demanding, yet such traces shall denote exceptional conditions anyway.
There is also an additional trace severity, void, that designates traces that shall be muted in all cases. Its purpose is to provide another means of muting/unmuting some traces, instead of commenting out/uncommenting said traces, or relying, thanks to cond_utils, on conditionally-compiled code.
Trace Content
Note
This section is not of interest for Traces users, it is only useful if wanting to integrate other tools or simply to have a look under the hood.
The traces corresponding to an execution are represented as an wallclock-time ordered stream of trace messages.
These traces are possibly exchanged over the network or stored in a file, whose extension is conventionally .traces.
For example the traces for a test named my_foobar_test are typically stored in a my_foobar_test.traces file, generated by the trace aggregator in the directory from which the corresponding test was launched.
Following data is associated to a given trace:
- technical identifier of the emitter, as a string (e.g. <9097.51.0> for the PID of a distributed Erlang process)
- name of the emitter (e.g. "Instance tracker")
- dotted categorization of the emitter (e.g. "Core.Tracker.Instances"); here for example the emitter is an element of the service in charge of the instances, which itself belongs to the tracker services, which themselves belong to the (even more general) core services
- application-level timestamp (e.g. operation count, relative tick, absolute timestep, or any complex, application-specific timestamp, etc.), possibly none, or undefined if not applicable (e.g. a simulation that would not be started yet)
- wall-clock timestamp, in the "Year/Month/Day Hour:Minute:Second" format (e.g. "2016/6/10 15:43:31"); this is an emitter-side timestamp (hence not related to the wallclock time known of the trace aggregator)
- emitter location, as a string (e.g. the name of the Erlang node, possibly including the name of the application use case, of the user and of the host; e.g. my_foobar_test_john@hurricane.org)
- dotted categorization of the trace message itself (e.g. MyApp.MyTopic.MyTheme)
- severity of the trace message (mapped to an integer level, as discussed above)
- the trace message itself, an arbitrary text of arbitrary length
Trace Emission
The following header is to be included so that an Erlang process can send traces:
-include("class_TraceEmitter.hrl").
or, better, in an OTP-compliant fashion:
-include_lib("traces/include/class_TraceEmitter.hrl").
This process can be a standalone module (e.g. a test or an application launcher, see trace_management_test.erl) or, more frequently, it might correspond to a WOOPER (active or passive) instance, in which case it shall inherit, directly or not, from class_TraceEmitter (see class_TestTraceEmitter.erl for a complete example of it).
From Member Methods
Then, once a State variable that corresponds to a class_TraceEmitter state is available in the scope of a method, sending primitives can be directly used, like in:
?info("Hello world!")
or:
?info_fmt("The value ~B is the answer.", [MyValue])
Many API variations exist (see class_TraceEmitter.hrl), to account for the various trace content, contexts, etc., but ?S(Message) and ?S_fmt(MessageFormat, MessageValues), for S corresponding to a trace severity (e.g. S being notice), are by far the most frequently used.
From Constructors
Note that for example ?debug(Message) is a macro that (if Traces is enabled) expands (literally) to:
class_TraceEmitter:send(debug, State, Message)
As a result, the availability of a State variable in the scope of this macro is expected. Moreover, this WOOPER state variable shall be the one of a class_TraceEmitter instance (either directly or, more probably, through inheritance).
This is not a problem in the most common case, when using traces in member methods (as by design they should be offering such a State), yet in constructors the initial state (i.e. the State variable directly fed to the construct operator of this class) is generally not the one of a trace emitter already (it is a blank state).
As a result, an instance will not be able to send traces until the completion of its own class_TraceEmitter constructor, and then it shall rely on that resulting state (for example named TraceState). Sending a trace of severity S from that point should be done using a send_S macro (e.g. ?send_debug(TraceState,Message)) - so that an appropriate state is used.
An example of some class Foobar inheriting directly from TraceEmitter will be clearer:
-module(class_Foobar).

construct(State,TraceEmitterName) ->
  TraceState = class_TraceEmitter:construct(State,TraceEmitterName),
  % Cannot use here ?info("Hello!), as it would use 'State',
  % which is not a trace emitter yet! So:
  ?send_info(TraceState,"Hello!"),
  [...]
  FinalState.
By Using a Trace Bridge
Traces can also be emitted thanks to Myriad's trace_bridge.
This is especially useful when developing lower-level libraries that can depend on Myriad, but may introduce extra runtime dependencies such as WOOPER and Traces - only optionally.
Using that bridge, the traces will by default go through Myriad's low level trace_utils, unless Traces is available, in which case its default trace aggregator will be used [3]. In this case, except for the emitter categorization (set to Trace Bridge), these messages cannot be discriminated from the ones sent the usual way from a TraceEmitter.
| [3] | The trace bridge is provided by Ceylan-Myriad and works by storing in the process dictionary a trace_bridge:user_bridge_info/0 term enabling the use of any specific trace system, like Ceylan-Traces here. |
A bridge may also be used in order to send traces (for example with trace_bridge:debug("Hello")) from functions that are executed in the context of a TraceEmitter instance, but do not have a Traces-enabled state in their scope. Having run once the class_TraceEmitter:register_bridge/1 helper function before, with a proper TraceEmitter state, is sufficient for that.
Such a bridge is also useful whenever spawning processes that do not have direct trace emitter state of their own, yet may at least in some cases have to send traces; the bridge allows them to act as a trace emitter (see the class_TraceEmitter:register_as_bridge/{2,3} static methods).
Refer to trace_bridging_test.erl for a complete example of use of an ad-hoc bridge.
Trace Categorisation
In addition to browsing the produced traces per emitter, origin, theme, wallclock or applicative timestamps, etc. it is often useful to be able to sort them per emitter categorisation, such a categorisation allowing to encompass multiple emitter instances of multiple emitter types.
Categories are arbitrary, and are to be nested from the most general ones to the least (a bit like directories), knowing that subcategories are to be delimited by a dot character, like in: Art.Painting.Hopper. As a consequence, any string can account for a category, keeping in mind dots have a specific meaning.
Hierarchical categorisation allows to select more easily a scope of interest for the traces to be browsed.
For example, should birds, cats and dogs be involved, introducing following emitter categorisations might be of help:
- Animals
- Animals.Birds
- Animals.Cats
- Animals.Dogs
If wanting all traces sent by all cats to be gathered in the Animals.Cats trace category, one shall introduce in class_Cat following define before the aforementioned class_TraceEmitter.hrl include:
-define(trace_emitter_categorization,"Animals.Cats").
and use it in the constructor like the following example, where class_Cat inherits directly from class_Creature [4] - supposingly itself a child class of class_TraceEmitter:
| [4] | We chose on purpose, with class_Creature, a classname that differs from class_Animal, to better illustrate that trace categories can be freely specified. |
-module(class_Cat).

-define(trace_emitter_categorization,"Animals.Cats").
-include("class_TraceEmitter.hrl").

construct(State,TraceEmitterName) ->
  TraceState = class_Creature:construct(State,
                 ?trace_categorize(TraceEmitterName)),
  % Cannot use ?warning("Hello!), as it would use 'State',
  % which is not a trace emitter yet! So:
  ?send_warning(TraceState,"Cat on the loose!"),
  [...]
  FinalState.
Then all traces sent by all cats will be automatically registered with this trace emitter category.
The purpose of the trace_categorize macro used in the above example is to register the trace categorisation defined through the inheritance tree so that, right from the start, the most precise category is used for all emitted traces [5].
| [5] | Otherwise, should the various constructors involved declare their own categorisation (which is the general case) and send traces, creating a cat instance would result in having these traces sorted under different emitter categories (e.g. the one declared by class_Creature, then by class_Cat, etc.). Tracking the messages emitted by a given instance would be made more difficult than needed, using this macro allows to have them gathered all in the most precise category from the start. |
Sometimes a very large number of trace emitters exist, to the point that selecting them becomes tedious. One workaround is to sort them according to their prefixes (first characters), for an easier browsing thereof.
For example, instead of having, under a "characters" trace categorization , "John-Paul", "John-Mark", "John-Eric", etc., a "characters.John-" trace categorization could be preferred so that it groups all the characters named accordingly.
This can be done by replacing the use of the trace_categorize/1 macro (defined in class_TraceEmitter.hrl) above with a pair whose first element is the actual emitter name and second element is its original categorization augmented of a prefix obtained from its name (here this pair would simply be {"John-Mark", "characters.John-"}).
Refer to class_TraceEmitter:subcategorize/1 for an example where an additional grouping level is introduced, based on the first character of the trace emitter name. Then if a specified emitter name would have been "some.prefix.foobar", this function ensures that "some.prefix.f.foobar" is used, resulting in an alphabetical dispatching of emitter names (and this emitter being sorted among all the ones whose name starts with f).
Activation / Desactivation
The trace macros used above can be fully toggled at build-time, on a per-module basis (if disabled, they incur zero runtime overhead, and no source change is required).
See the ENABLE_TRACES make variable in GNUmakevars.inc for that, and do not forget to recompile all classes and modules that shall observe this newer setting.
Note that an error-like trace severity will not be impacted by this setting, as such traces shall remain always available (never muted).
Doing so incurs a very low runtime overhead anyway (supposing of course that sending these failure-related messages happens rather infrequently), as the cost of a mostly idle trace aggregator (which is spawned in all cases) is mostly negligible - knowing that runtime resource consumption happens only when/if emitting actual traces.
Switching from Basic Console Traces
In some cases, it may be convenient to have first one's lower-level, debugging traces be directly output on the console.
Then, once the most basic bugs are fixed (e.g. the program is not crashing anymore), the full power of this Traces layer can be best used, by switching the initial basic traces to the more advanced traces presented here.
To output (basic) console traces, one may use the trace_utils module of the Myriad layer. For example:
trace_utils:debug_fmt("Hello world #~B",[2])
Then switching to the more advanced traces discussed here is just a matter of replacing, for a given trace type T (e.g. debug), trace_utils:T with ?T, like in:
?debug_fmt("Hello world #~B",[2])
(with no further change in the trace parameters).
Yet now, as already mentioned, there is a better way of doing so (not requiring trace primitives to be changed once specified), through the use of the trace_bridge module - which is also provided by the Myriad layer - instead.
It allows all Erlang code, including the one of lower-level libraries, to rely ultimately either on basic traces (i.e. the ones offered by Myriad in trace_utils) or on more advanced ones (typically the ones discussed here, offered by Traces - or any other respecting the same conventions) transparently (i.e. with no further change, once the emitter process is registered).
See trace_bridging_test.erl for an example of use thereof.
The Traceable Interface
This interface has been introduced so that other interfaces can depend on it rather than having their instances necessarily be a full-blown TraceEmitter.
In practice this interface, defined in class_Traceable.erl and class_Traceable.hrl, offers the same basic macros for trace sending as class_TraceEmitter, yet can be used by any WOOPER instance - be it a trace emitter or not, and, in this last case, whether or not having a trace bridge set; the relevant trace emission option is transparently used whenever having to emit an actual trace.
Trace Ordering
It should be noted that the ordering of the reported traces is the one seen by the trace aggregator, based on their receiving order by this process (not for example based on any sending order of the various emitters involved - there is hardly any distributed global time available anyway).
So, due to network and emitter latencies, it may happen (rather infrequently) that in a distributed setting a trace message associated to a cause ends up being listed, among the registered traces, after a trace message associated to a consequence thereof [6]; nevertheless each trace includes a wall-clock timestamp corresponding to its sending (hence expressed according to the local time of its trace emitter).
| [6] | A total, reproducible order on the distributed traces could be implemented, yet its runtime synchronisation cost would be sufficiently high to have a far larger impact onto the executions that this trace system is to instrument than the current system (and such an impact would of course not be desirable). |
Trace Output Generation
Trace Format Type
Traces may be browsed thanks to either of the following supervision solutions (see class_TraceSupervisor.erl):
- text_traces, itself available in two variations:
- text_only if wanting to have traces be directly written to disk as pure, yet human-readable, text
- pdf, if wanting to read finally the traces in a generated PDF file (hence the actual text includes a relevant mark-up, and as such is less readable directly before a PDF is generated out of it)
- advanced_traces, for smarter log tools such as LogMX (the default), as discussed below
Trace Rotation
Note also that trace rotation can be enabled: when requested, it is performed (in a synchronous or asynchronous manner, see the rotateTraceFile/1 oneway and the rotateTraceFileSync/1 request of the trace aggregator) unconditionally or based on a threshold in the size of the trace file (the default; see also the setMinimumTraceFileSizeForRotation/2 oneway).
Such trace rotation is typically meant to be triggered by a scheduler, on a regular basis (doing so is more relevant than for example checking a criterion at each trace addition).
If the current trace file is my_file.traces, its rotated version will be an XZ archive named for example my_file.traces.8.2021-1-17-at-22h-14m-00s.xz (the count, here 8, allows to keep track of a series of rotation archives, while the timestamp corresponds to the time at which the log rotation was done), located in the same directory.
Trace Supervision & Browsing
Indeed the tool that generally we use for trace browsing is LogMX (the only tool that we use that is not free software, as we find it convenient), which we integrated:
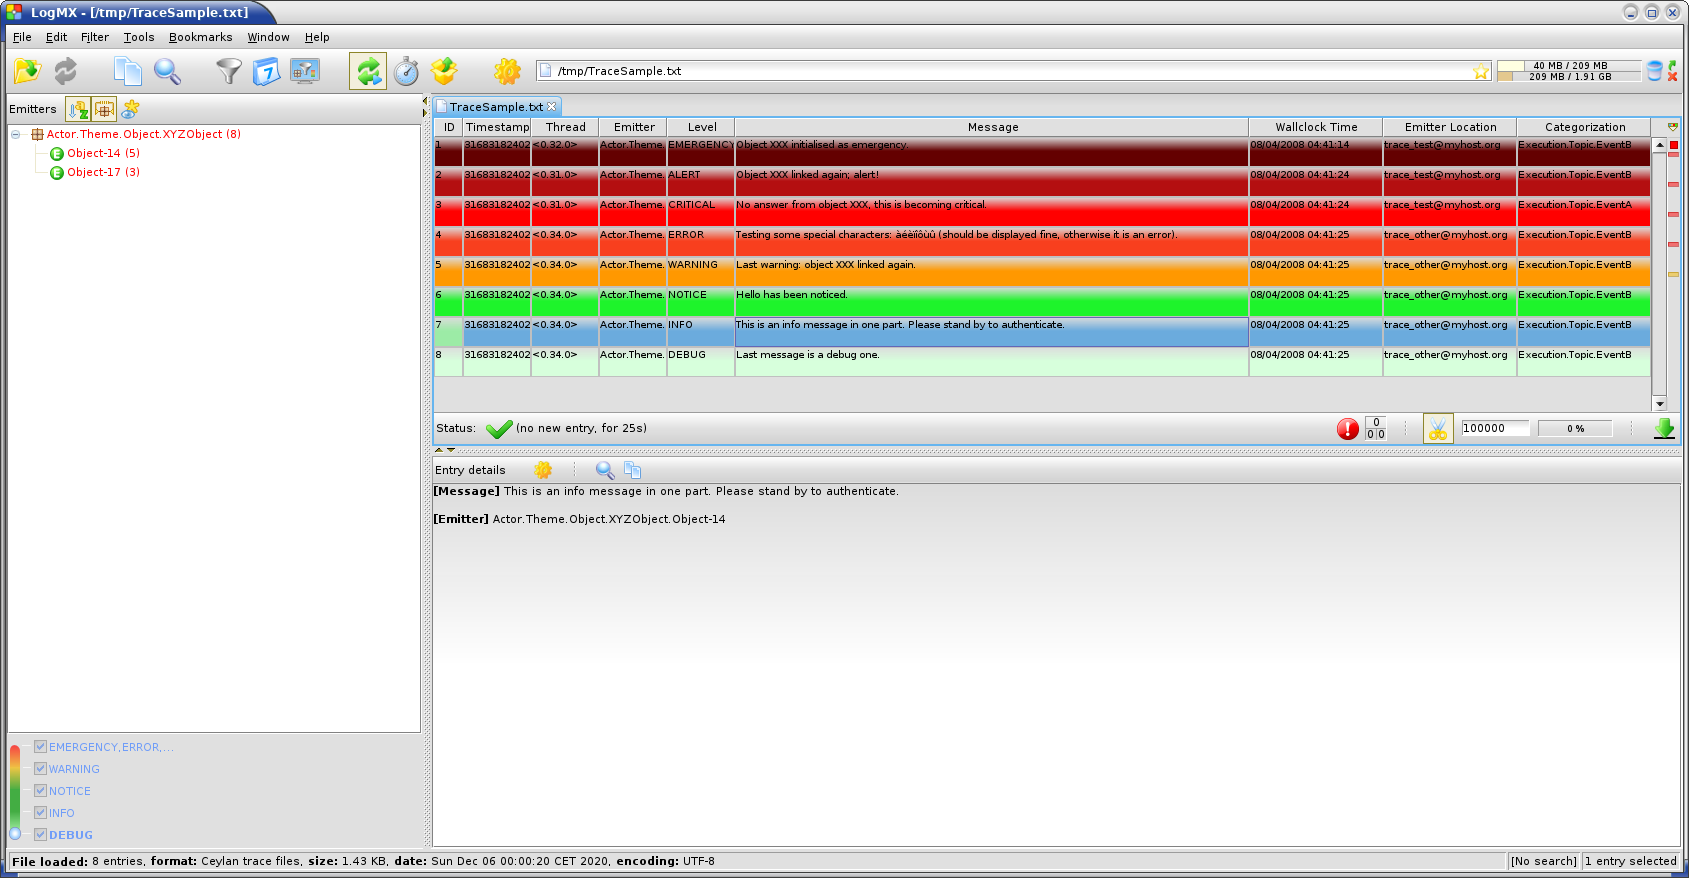
We implemented a Java-based parser of our trace format for LogMX (see CeylanTraceParser.java):
Traces can be browsed with this tool:
- live (i.e. during the execution of the program), either from its start or upon connection to the instrumented program whilst it is already running [7] (see class_TraceListener.erl and trace_listening_test.erl)
- post mortem (i.e. after the program terminated for any reason, based on the trace file that it left)
| [7] | In which case the trace supervisor will first receive, transactionally, a compressed version of all past traces; then all new ones will be sent to this new listener, resulting in no trace being possibly lost. |
The trace supervision solution can be switched at compile time (see the TraceType defined in traces/include/traces.hrl); the Traces layer shall then be rebuilt.
Trace Implementation
General Mode of Operation
All processes are able to emit traces, either by using standalone trace sending primitives (mostly for plain Erlang processes), or by inheriting from the TraceEmitter class, in the (general) case of WOOPER-based processes.
In the vast majority of cases, all these emitters send their traces to a single trace aggregator, in charge of collecting them and storing them on-disk (for most uses, their memory footprint would be quickly too large for RAM), according to an adequate trace format.
This trace format can be parsed by various trace supervisors, the most popular being LogMX.
Various measures have been taken in order to reduce the overhead induced by the overall trace system.
Notably normal traces (as opposed to error-like ones) are sent in a "fire and forget", non-blocking manner (thanks to oneways, which are not specifically acknowledged). The number of messages exchanged is thus reduced, at the cost of a lesser synchronization of the traces (i.e. there is no strong guarantee that the traces will be ultimately recorded and displayed in the order of their emission in wallclock-time, as they will be directly and sequentially stored in their actual order of receiving by the trace aggregator [8], an order that depends itself on the potentially varied network latencies experienced from the potential multiple sources to the trace aggregator).
| [8] | For example, if both the trace aggregator and a process B are running on the same host, and if a process A, running on another host, emits a trace then sends a message to B so that B sends in turn a trace, then the trace from B might in some cases be received - and thus be listed - by the aggregator before the trace for A (it depends on the network congestion, relative scheduling of processes, etc.). |
Trace Emitters
Any class deriving, directly or not, from class_TraceEmitter, is, once constructed as a trace emitter, able to send traces.
Timestamps
When sending a trace, an emitter relies on its trace_timestamp attribute, and sends a (binarised) string representation thereof (obtained thanks to the ~p quantifier of io:format/2 ). This allows the trace subsystem to support all kinds of application-specific timestamps (e.g. integers, floats, tuples, strings, etc.).
Multiple Inheritance
Often, in an application, many classes derive - directly or not - from class_TraceEmitter. The constructor of this class is designed to perform its initialisation exactly once (as opposed to as many times as a given class inherits from class_TraceEmitter), the first time it is called (leading typically to the most relevant emitter state in terms of name, categorization, etc.).
Refer to this WOOPER section about diamond-shaped inheritance for further details.
Lowering the Trace-Induced Overhead
In addition to the general efficiency measures already taken, an (optional) "preformatted" mode has been introduced in order to further lower the cost induced by the processing of traces; this mode can be freely used in parallel to the normal, "legacy" mode, in the same program.
At the expense of supporting only our "advanced" trace supervision type (as opposed to the "text" one typically useful for PDF generation), this mode strives to:
- reduce the volume of data sent for each trace (from a richer tuple per trace to a single, compact binary)
- increase overall concurrency by, as much as possible, offsetting the load from the trace aggregator (which by design is a singleton) to the many trace emitters
Using this mode is transparent, and, in case of heavy trace sending, a significant decrease in resource usage could be measured.
To enable/disable this mode, refer to the traces_are_preformatted define, which is now set by default (see the TRACES_OPT_FLAGS variable in GNUmakevars.inc).
Internal Trace Format
(for the most curious users)
Each trace line is a raw text (hence not a binary content) made of a series of predefined fields, separated by the pipe (|) delimiter character.
The text message included in a trace can contain any number of instances of this field delimiter.
Example of a raw trace line (end of lines added for readability):
<0.45.0>|I am a test emitter of traces|TraceEmitter.Test|none|
2016/6/13 14:21:16|trace_management_run-paul@hurricane.foobar.org|
MyTest.SomeCategory|6|Hello debug world!
or:
<9097.51.0>|Instance tracker|Core.Tracker.Instances|14875|
2016/6/10 15:43:31|My_application_case-john@hurricane.foobar.org|
Execution.Uncategorized|4|Creating a new root instance tracker
whose troubleshooting mode is enabled.
Supported Platforms
Traces can be readily built and run on most Unices (including of course GNU/Linux) and on Windows.
Refer to the Myriad counterpart section for more details.
Licence
Ceylan-Traces is licensed by its author (Olivier Boudeville) under a disjunctive tri-license giving you the choice of one of the three following sets of free software/open source licensing terms:
- Mozilla Public License (MPL), version 1.1 or later (very close to the former Erlang Public License, except aspects regarding Ericsson and/or the Swedish law)
- GNU General Public License (GPL), version 3.0 or later
- GNU Lesser General Public License (LGPL), version 3.0 or later
This allows the use of the Traces code in as wide a variety of software projects as possible, while still maintaining copyleft on this code.
Being triple-licensed means that someone (the licensee) who modifies and/or distributes it can choose which of the available sets of licence terms he/she is operating under.
We hope that enhancements will be back-contributed (e.g. thanks to pull requests), so that everyone will be able to benefit from them.
Current Stable Version & Download
As mentioned, the single, direct prerequisite of Ceylan-Traces is Ceylan-WOOPER, which implies in turn Ceylan-Myriad and Erlang.
We prefer using GNU/Linux, sticking to the latest stable release of Erlang, and building it from sources, thanks to GNU make.
Refer to the corresponding Myriad prerequisite section for more precise guidelines, knowing that Ceylan-Traces does not need any module with conditional support such as crypto or wx.
Using Cutting-Edge Git
This is the installation method that we use and recommend; the Traces master branch is meant to stick to the latest stable version: we try to ensure that this main line always stays functional (sorry for the pun). Evolutions are to take place in feature branches and to be merged only when ready.
Once Erlang is available, it should be just a matter of executing:
$ git clone https://github.com/Olivier-Boudeville/Ceylan-Myriad myriad
$ cd myriad && make all && cd ..

$ git clone https://github.com/Olivier-Boudeville/Ceylan-WOOPER wooper
$ cd wooper && make all && cd ..

$ git clone https://github.com/Olivier-Boudeville/Ceylan-Traces traces
$ cd traces && make all
(for OTP compliance, using short names, such as myriad, wooper and traces, for clones rather than long ones, such as Ceylan-Myriad, Ceylan-WOOPER and Ceylan-Traces, is recommended)
Running a corresponding test just then boils down to:
$ cd test && make trace_management_run CMD_LINE_OPT="--batch"
Should LogMX be installed and available in the PATH, the test may simply become:
$ make trace_management_run
Testing Traces
Once the prerequisites (Myriad and WOOPER) and Traces itself have been secured (for that refer to either Using Cutting-Edge Git or Using Rebar3), just run from the root directory of Traces:
$ make test
The testing shall complete successfully (if it is not the case, see our support section).
Note
Traces is built and tested at each commit through continuous integration, and the same holds for its two prerequisites (Myriad and WOOPER). Reciprocally this procedure applies to the projects based on it (e.g. US-Web), so in terms of usability, confidence should be high.
Trace Supervisors
Currently, in practice, traces may be browsed as simple text files, PDF files or Traces (*.traces) files (thus following the Traces file format, which is currently read only by our corresponding trace parser).
We certainly recommend LogMX - whose only constraint is to be a commercial tool.
We did not really find very relevant open-source alternatives (they would have notably to be feature-rich, stable, actively maintained, distributed with a suitable free software license.
The best contenders that we identified are:
Troubleshooting
Lost Traces
If having sent traces that cannot be found through the trace supervision (or that even disappear live!), most probably that they were properly sent, collected and stored, but that they were too numerous to be displayed.
In LogMX, this can be seen in the bottom-right status bar, where a fully-filled red rectangle shows the percentage of the maximum number of entries currently met: 100% most likely means that too many traces were to be displayed for the current settings, and thus that latter traces replaced former ones.
A solution is either to send less traces, or to increase that display threshold, either directly in to the LogMX interface (by entering an higher value on the left of said rectangle), or in the logmx.properties configuration file, by setting its autoRefreshEntriesLimit attribute to an higher value.
A related setting is the max memory that the (Java) configuration of LogMX allows.
Duplicated Traces
In rather rare contexts (typically when requesting LogMX to focus on the last entries, whereas dozens of thousands of them are added), the trace supervision may show duplicated traces.
For example, an emitter that sent 6 traces will be marked as having sent 8 of them, and a pair of successive traces will be shown twice (first that pair, then other traces may interleave, then the pair will be listed again), with non-duplicated IDs (as shown in the leftmost LogMX column).
It is just an artefact due to this specific execution of LogMX though: one can check that reading this file again, but this time as a whole (instead of live) does not show duplicated traces anymore; indeed these traces were actually stored by Ceylan-Traces in the *.traces file only once.
Lost LogMX Settings
LogMX will write its configuration files (notably logmx.properties) when shutdown. So before modifying any of these files, ensure first that no LogMX instance is still running (otherwise one's changes will be overwritten).
Java Error When Launching LogMX
One may check that Java is installed and available from the PATH, that it is a sufficiently recent one (e.g. Java 11; more recent ones like Java 21 will work of course) and that it is at least a JRE (a complete JDK will be fine as well) and a full (non-headless [9]) version thereof.
| [9] | Otherwise the following link error may be reported: Exception in thread "main" java.lang.ExceptionInInitializerError... Caused by: java.awt.HeadlessException due to a lacking libawt_xawt.so. Then just replace your headless version with a full one. |
One may use check with:
$ type java
java is /usr/bin/java

$ java -version
openjdk version "21" 2023-09-19
OpenJDK Runtime Environment (build 21+35)
OpenJDK 64-Bit Server VM (build 21+35, mixed mode, sharing)
Arch users may also install a relevant Java with pacman -Sy jre-openjdk and run archlinux-java status to check which version shall be used (then possibly archlinux-java set java-21-openjdk to select it).
Requested Widths for LogMX Entry Columns Not Honored
The preferred respective widths for the various entry columns can be set (in Tools -> Options -> Display, thanks to the Entries table columns... button) and recorded (in logmx.properties), yet, with some versions of Java, such settings might not be respected.
At least on Arch Linux, switching (thanks to archlinux-java) from java-24-openjdk back to java-11-openjdk allowed to restore the correct management of these settings (otherwise ignored with more recent Java versions - at least with ancient versions of LogMX).
Support
Bugs, questions, remarks, patches, requests for enhancements, etc. are to be reported to the project interface (typically issues) or directly at the email address mentioned at the beginning of this document.
Please React!
If you have information more detailed or more recent than those presented in this document, if you noticed errors, neglects or points insufficiently discussed, drop us a line! (for that, follow the Support guidelines).